Kubecost is a cloud-agnostic tool that provides real-time cost visibility and insights on your cluster, helping you take decisions regarding your cloud costs related to Kubernetes.
In this post, I will show you how to install kubecost and I will guide you through its interface to extract the best it can give us. I will be demonstrating against an EKS cluster (AWS) but since kubecost is cross cloud, everything I write is relevant for other cloud provider.
Installing Kubecost
Running this simple helm command will install kubecost on a new namespace. Make your to replace the <your_cluster_id> in the command below by the correct value in your setup.
helm upgrade -i kubecost oci://public.ecr.aws/kubecost/cost-analyzer --version 1.96.0 --namespace kubecost --create-namespace -f https://raw.githubusercontent.com/kubecost/cost-analyzer-helm-chart/develop/cost-analyzer/values-eks-cost-monitoring.yaml --set prometheus.server.global.external_labels.cluster_id=<your_cluster_id>
Output
Release "kubecost" has been upgraded. Happy Helming!
NAME: kubecost
NAMESPACE: kubecost
STATUS: deployed
REVISION: 1
TEST SUITE: None
NOTES:
--------------------------------------------------Kubecost has been successfully installed.

Please allow 5-10 minutes for Kubecost to gather metrics.

If you have configured cloud-integrations, it can take up to 48 hours for cost reconciliation to occur.

When using Durable storage (Enterprise Edition), please allow up to 4 hours for data to be collected and the UI to be healthy.

When pods are Ready, you can enable port-forwarding with the following command:

    kubectl port-forward --namespace kubecost deployment/kubecost-cost-analyzer 9090

Next, navigate to http://localhost:9090 in a web browser.

Having installation issues? View our Troubleshooting Guide at http://docs.kubecost.com/troubleshoot-install
Now let’s run this command to see what was installed:
kubectl get pods -n kubecost
The output is the following
NAME                                           READY   STATUS    RESTARTS   AGE
kubecost-cost-analyzer-55974b5bfd-nwjnl        2/2     Running   0          1m
kubecost-kube-state-metrics-59fd4555f4-gfprj   1/1     Running   0          1m
kubecost-prometheus-server-55768b7cbb-2cjnf    1/1     Running   0          1m
It indicates us that kubecost has 3 components:
- the cost-analyzer pod holds all the k8s cost processing logic
- the kube-state-metrics pod listens to the Kubernetes API server and generates metrics about the state of various objects in your cluster (Deployment, Pod, Node, …)
- the prometheus-server pod collects, store and displays the metrics gathered by the above component
The cost-analyzer workload comes with a front-end interface (listening at port 9090) to let you visualize everything. We can access this interface by running
kubectl port-forward --namespace kubecost deployment/kubecost-cost-analyzer 9090
Now you can access it at http://localhost:9090/.
Note that you need to give kubecost 5-10 minutes to prepare the data for you. Otherwise you might land on that page.

Navigating through the Kubecost UI
I’ll be honest with you. A minimalist article (as I try to produce here) does not offer enough lines to comprehensively describe the capabilities of Kubecost. I’ll keep such deep immersion into Kubecost functionalities for a future article, possibly.
However, I will do my best to show you the fundamental results Kubecost supplies as well as the ideas that lie behind those.
Kubecost UI has 7 different sections:
- Overview (summarizing results from the below sections)
- Cost Allocation
- Assets
- Savings
- Health
- Reports
- Alerts
Cost Allocation Dashboard
This screen allows you to see allocated costs by object. For example, you can see how much the namespace “api-gateway” is taking part in the total cost of you cluster.
Here is the default report you will see on the dashboard. We see how much we spent Today (see red arrow — Date Range) on each Namespace (see blue arrow — Aggregate by). Note that we see for now “cumulative cost” so if you just installed kubecost, the data you will see will not make a lot of sense since cumulative cost over a few minutes is not telling us a lot.
By default the cost metric is Cumulative Cost which is often not very relevant in cost analysis. Remember to change this to Hourly Cost, Monthly Cost or one of the other costs if you want to have a general idea of your costs.

You can modify the data presented by this dashboard by selecting another data range, aggregating by another (or other) object(s). You can also modify the dashboard by clicking on the icon pointed by a green arrow in the above image. Click on it and you will be able to see this

Under Cost metric you can choose what cost you will wish to see. The most common and useful cost metrics are “Hourly Rate” and “Monthly rate”.
Under Chart you can select the nature of the graphics chart you want to see.
Under Idle costs you can select how you wish to see the idle costs of the cluster presented to you. (here we are touching an important concept that I will define shortly)
Pod Resource Efficiency and Idle cost
Cluster idle cost is defined as the difference between the cost of allocated resources and the cost of the hardware they run on. Allocation is defined as the max of usage and requests. It can also be expressed as follows:

Pod resource efficiency percentage is defined as the resource utilization versus the resource request over a given time window. It is cost-weighted and can be expressed as follows:

While too low resource utilization is wasteful, too high utilization can lead to latency increases, reliability issues, and other negative behavior. You will need to target your efficiency and idle costs depending on the nature of your cluster. Thus the need for talented and experience engineers that understand well your software (and its risks) as well as the steps you can take in your cluster management to meet your operation availability while optimizing costs.
Please, consider Kubecost as a visualization tool that helps you take decisions and not a tool that decides for you.
Assets Dashboard
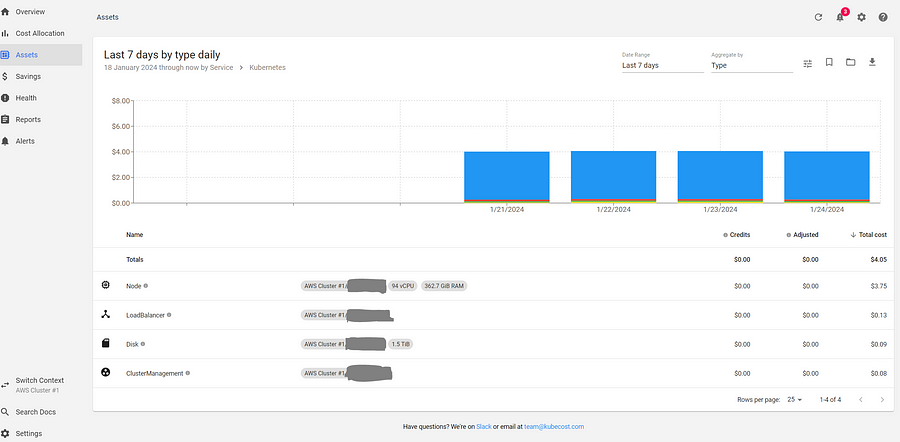
The Kubecost Assets dashboard shows Kubernetes cluster costs broken down by the individual backing assets in your cluster such as : Node cost, Disk cost, LoadBalancer cost, Cluster Management cost and more.
Note that this dashboard, like the Cost Allocation dashboard we saw before, can be customized and the data it displays can be configured like we did in the previous dashboard.
By default, you should see something like this

Click on “Kubernetes” pointed by my red arrow, and you will see all the assets in your cluster with how much its costs you. (remember to change the cost metric to “Hourly rate”)

If you click on Node, you will have
Savings Dashboard
The Savings dashboard displays an array of panels containing different suggestions capable of lowering your Kubernetes and cloud spend.

The insights proposed by this dashboard are the following:
- Right-size you cluster nodes
- Right-size your container requests
- Remedy abandoned workloads
- Manage unclaimed volumes
- Manage local disks
- Manage underutilized nodes
- Right-size your persistent volumes
My insight is to be careful with those insights if we deal with a critical cluster. I don’t think there are “ready-to-use” recipes to optimize Kubernetes cluster costs. Cost optimization must take into account the nature of your application, your target client, the components your application uses and more parameters.
More on that in another article…
You won’t change a bolt of a night table like you change a bolt of an aircraft engine because the impacts are very different.
Health Dashboard
The Health dashboard does not deal with cost analysis but rather issues a health score for your cluster. This score is based on some parameters that I will not describe here.
You are welcome to check this link to understand more about the health score : https://docs.kubecost.com/using-kubecost/navigating-the-kubecost-ui/cluster-health-score
Reports Dashboard
The reports dashboard is similar to the “Bookmarks” section in web browsers. In the Reports dashboard, you will be able to find Asset and Cost Allocation charts that you decided to save for future use. Remember that in the Asset and Cost Allocation dashboards, you could configure several parameters that impacted the way the chart was presented. Once you have an Asset/Cost Allocation chart that suits you, you can save it by clicking the bookmark icon.
Let’s say you want to save the report of the Daily Cost of your Assets over the last 24h. Then you will want to configure this and then click the bookmark icon (pointed by a red-arrow in the image below)

Alerts Dashboard
According to me, this is the most valuable dashboard Kubecost provides (for free). It allows you to receive alerts via e-mail or Slack about the behavior of your cluster.
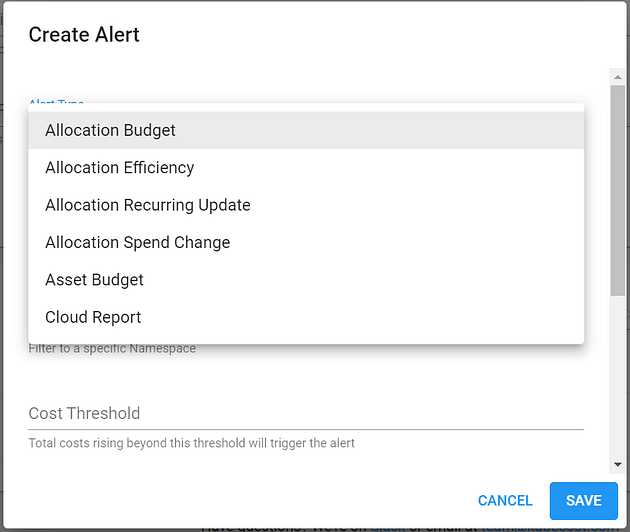
Click on the Create Alert button and you should choose among those alert types

I won’t describe each one of its categories and again you are welcome to document yourself about it here https://docs.kubecost.com/using-kubecost/navigating-the-kubecost-ui/alerts.
I will however show you an example of how we can create an alert that sends us an email when our Nodes exceed a daily 800$ expense. It would look something like this.

Lower, under the Recipients section, you can write a list of email addresses or a Slack webhook this alert should be sent to.
